PVEL’s Damp Heat (DH) test simulates long-term degradation and failure modes that are typical in high temperatures and high humidity conditions where moisture and heat can weaken the materials binding the PV module together. When the adhesiveness of these materials weakens due to low-quality components and/or substandard lamination processes, moisture can enter the laminate and corrode internal materials. The result is potential performance loss and safety issues.
Damp Heat
Why Damp Heat Testing Matters
The site owner of a Taiwanese 1.1 MW rooftop site, commissioned in 2016, started noticing underperformance after five years of operation when comparing it to their other sites. Extel Energy, a member of the Kiwa Group, was appointed to inspect the site. Their visual inspection discovered that the modules had significant corrosion of the metallization around the cells’ perimeter, along with ‘snail trails’ at microcrack locations. It was clear that moisture entered through the backsheet and encapsulant, causing corrosion on the cell surface. 100% of the modules were affected.
According to research conducted by Dr. Todd Karin, PVEL’s VP of Technical Operations, on Photovoltaic Climate Zones, Taiwan has an H7 Specific Humidity rating¹. This type of cell corrosion is expected to occur faster and be more prevalent in these high humidity areas.
Cell corrosion similar to this has been observed in PVEL’s Damp Heat test results, but may not be evident after the shorter, 1000 hour IEC 61215 test. As more solar capacity gets deployed in the high heat and high humidity regions between the tropics, the PQP’s extended Damp Heat test becomes imperative to avoid field failures.
Source: (1) Karin, T., Birk Jones, C., Jain, A. Photovoltaic Climate Zones: The Global Distribution of Climate Stressors Affecting Photovoltaic Degradation. EUPVSEC (2019). View
The lighter color around the cells’ perimeter is visual evidence of corrosion.
The site owner arranged for a sample of modules to be sent for EL imaging, where signs of corrosion around the cells’ perimeter were even more obvious.
Specific Humidity zones across the globe according to the Photovoltaic Climate Zone classification system.
Materials Assessed
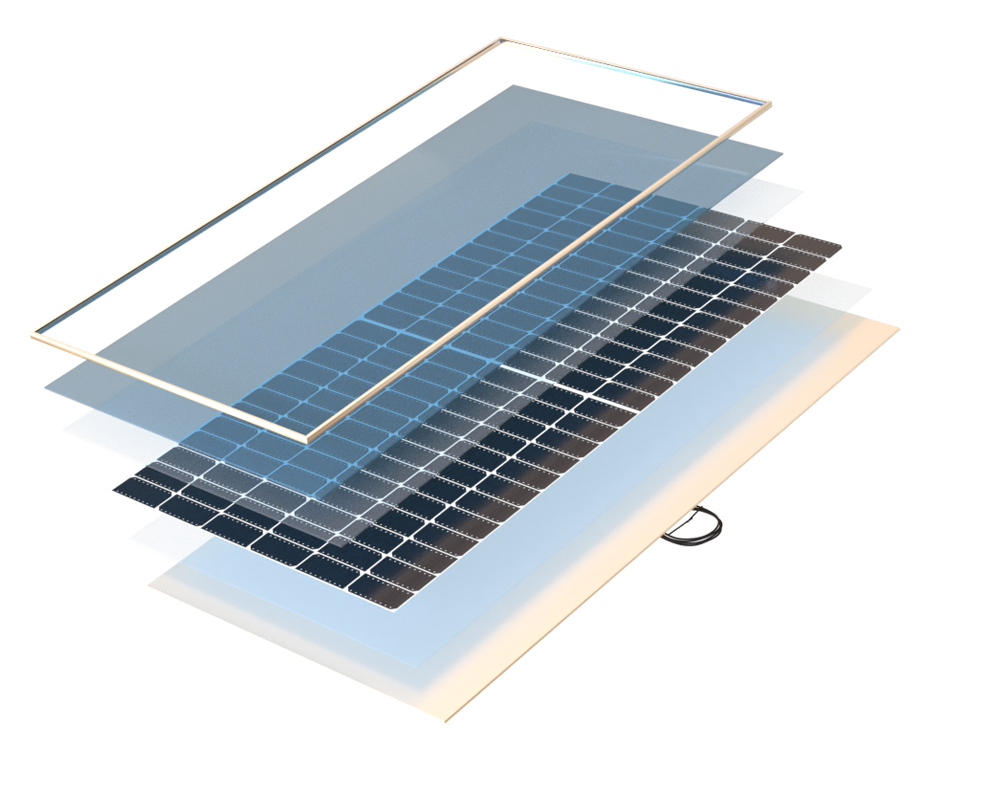
These materials all play a role in protecting the PV module from environmental elements and ensuring that all components are firmly bonded together and resistant to corrosion:
- Cells
- Encapsulant
- Glass Coating
- Junction Box
- Cell Interconnects
- Connectors
- Backsheet
- Junction Box Pottant
- Junction Box Adhesive
- Flux
- Frame Adhesive
1.3% median degradation. 1.5% average degradation.
1.0% median degradation for glass//glass versus 1.9% for glass//backsheet.
Average degradation was 1.2 to 1.7% across CdTe, HJT, PERC and TOPCon.
DH-related power loss failures drop to zero.
Test Procedure
DH subjects modules to a constant 85°C and 85% relative humidity in an environmental chamber for two periods of 1000 hours each. This test is twice the duration required for IEC certification in order to identify additional module failure modes where the combination of high heat and intense moisture stresses the PV module layers.
Environments with high temperatures and no current can lead to a destabilization of PV cell boron-oxygen (BO) complexes. This leads to power loss in some boron-doped PERC cells, which may not occur in the field. To reverse this effect, PVEL conducts a BO stabilization process at the end of the DH test sequence. This stabilization step helps separate BO-induced power loss from traditional DH-induced power loss, but is less of a concern for non-boron-doped cells, such as gallium-doped, n-type or CdTe thin-film.
Power Degradation of Each Model Type
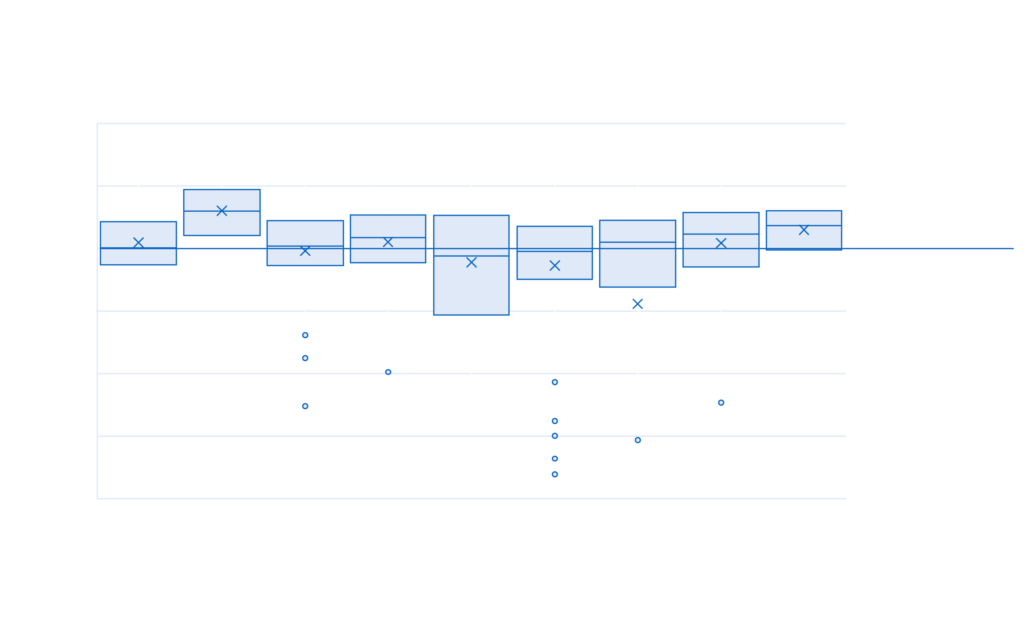
Percentage of results shown that are post-BO stabilization: 19% of 2018, 46% of 2019, 95% of 2022, 86% of 2021. All 2022 results are post-DH2000 (pre-BO stabilization), which is the stage in DH testing used to determine Top Performers for the 2023 Scorecard. Some outliers with >10% degradation are not shown.
DH Test Result Spotlight
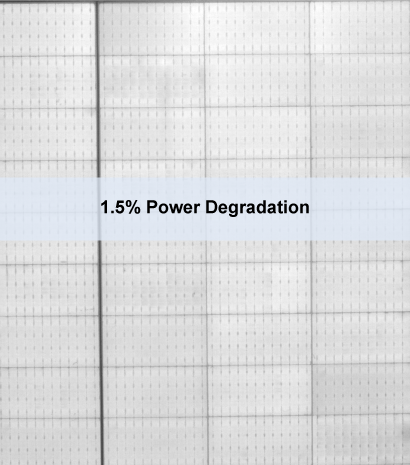
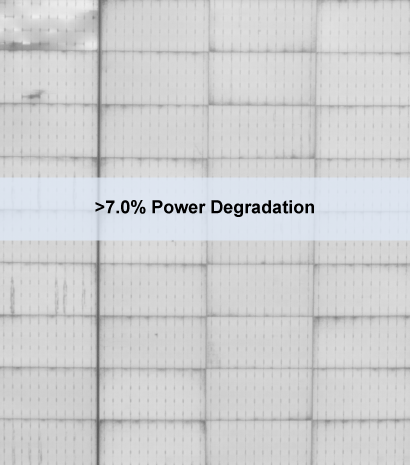
PVEL tested two BOMs produced by the same module manufacturer that used the same cells and same front encapsulants. One was glass//glass, the other was glass//backsheet. The glass//glass BOM was a Top Performer in damp heat testing, but the glass//backsheet BOM had >7% power loss after the same test. The backsheet clearly allowed moisture to enter the laminate leading to cell corrosion.(EL images have been cropped to maintain anonymity.)

