Mechanical Stress Sequence

Why Mechanical Stress Sequence Testing Matters

Researchers at the Fotovoltaica-UFSC recently designed a 100 kWp site to evaluate bifacial silicon PV module performance under Brazilian climatic conditions. Located in Florianópolis-SC, Brazil, the project uses large-format bifacial glass//glass modules with 2 mm heat-strengthened glass, installed across five single-axis tracking rows and one fixed-tilt system. Little did they know that they would actually be studying module glass breakage.

Not long after site commissioning, the researchers noticed glass cracks on the front or rear of some modules. Regular inspections were conducted and a trend of 14 broken modules per month was recorded over a seven-month period. Within nine months of site commissioning, over 50% of the installed modules had cracked glass. The weather monitoring data over this period did not show any temperature or wind event anomalies.

To date the glass cracks have not impacted system safety or performance. The researchers have thus far found no correlation between glass cracks and cell cracks on EL images, power degradation, or hot spots. But the long-term reliability of modules with broken glass is certainly at risk. The root cause analysis is still ongoing with the module and racking/tracker manufacturers involved.

This is not a unique case of module breakage in the solar industry. The Kiwa Group members have been contacted multiple times in the past year with reports of broken glass on PV sites. Tracker/racking compatibility with large-format modules is critical, and PVEL’s MSS testing on specific module and tracker/racking combinations provides site stakeholder confidence in avoiding these types of issues.

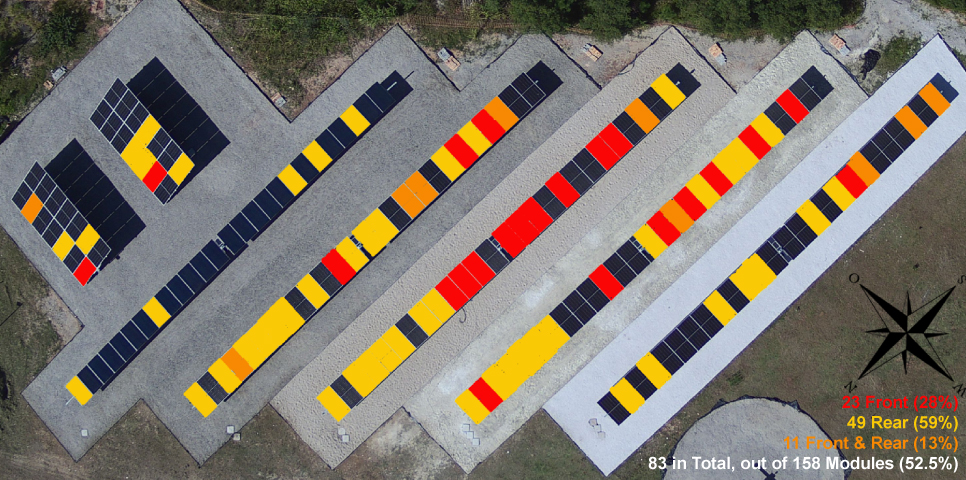
In the majority of cases (59% of all cracked modules) the rear side glass broke. 28% of cracked modules had broken front side glass, and 13% of cracked modules had both front and rear glass broken.

Number of PV modules with cracked glass. The trend line represents ~14 cracked modules per month.

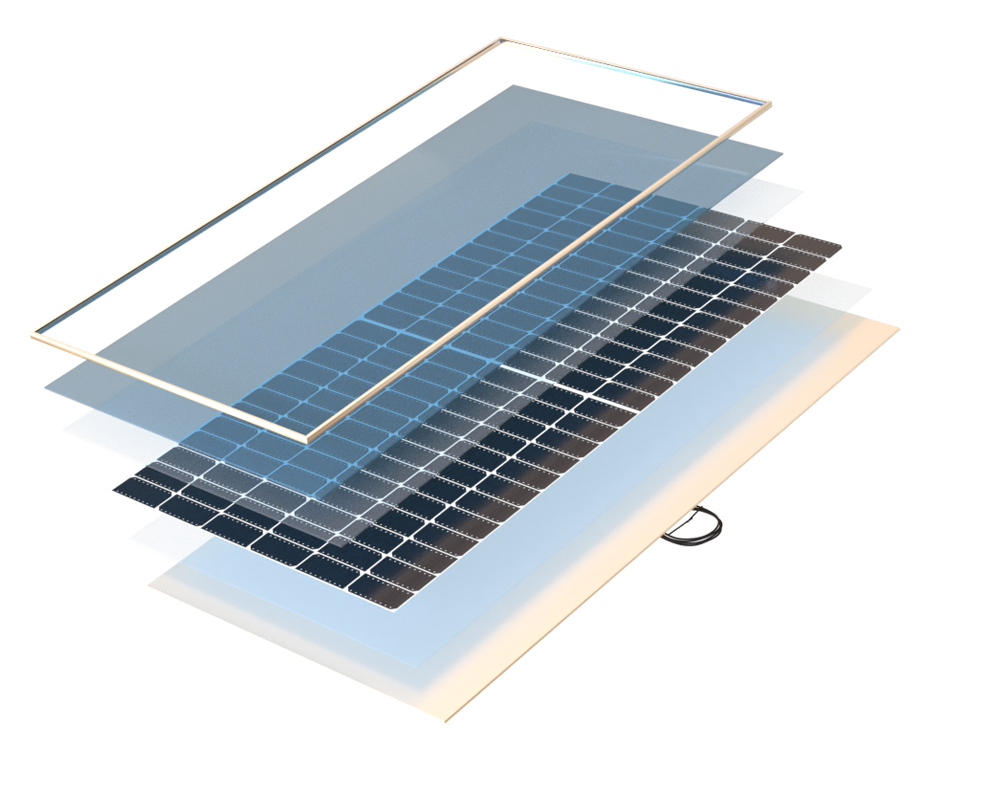
Frame, Frame Adhesive
Glass
Front Encapsulant
Back Encapsulant
Cells, Cell Interconnects
Backsheet
Junction Box Adhesive

Materials Assessed

These materials influence the mechanical strength of the cell interface as well as the durability and rigidity of the PV module itself:

  • Cells
  • Encapsulant
  • Cell Interconnects
  • Glass
  • Backsheet
  • Frame
  • Frame Adhesive
  • Junction Box Adhesive
  • Module Size
Explore PVEL’s Test Methodology
Key Takeaways
Scroll through the key takeaways.

98% of BOMs tested had less than 2% power loss.

Multi-busbar (9BB or greater) results in less opportunity for inactive areas to form across cracked cells, leading to the lowest average and median MSS degradation rates in PVEL’s history.

No additional cracked cells seen in glass//glass modules.

With cells in the neutral plane, no glass//glass module experienced cell-level damage following MSS, resulting in lower average and median power loss than glass//backsheet modules.

MSS tracker-mounting reveals more issues.

While PVEL reports the best ever MSS results when modules were mounted using traditional two-rail mounting, mixed results were seen in tracker-mounted MSS, with multiple modules breaking during 1800 Pa SML or subsequent DML.

7% of BOMs tested experienced an MSS-related failure.

During SML testing the glass in glass//glass modules was over twice as likely to break than for glass//backsheet modules. Additionally, in one glass//glass BOM the TC50 + HF10 portion of the test led to delamination along the module edge.

Test Procedure

MSS is comprised of four tests in sequence: static mechanical load (SML), dynamic mechanical load (DML), thermal cycling, and humidity freeze. The mechanical loading steps create and propagate cracks in susceptible modules, and then power loss is induced through the environmental stress of thermal cycling and humidity freeze.

SML includes three rounds of one hour of downward force and one hour of upward force at 2,400 Pa. The subsequent DML test comprises 1,000 cycles of oscillating positive-negative loading at ±1,000 Pa. During load testing the modules are typically mounted using traditional two-rail fixed tilt mounting methods. A tracker-mount variant test is optional as part of PQP testing. After load testing modules are placed in an environmental chamber to undergo 50 thermal cycles (-40°C to +85°C) followed by 10 cycles of humidity freeze (+85°C and 85% relative humidity, then a rapid drop to -40°C).

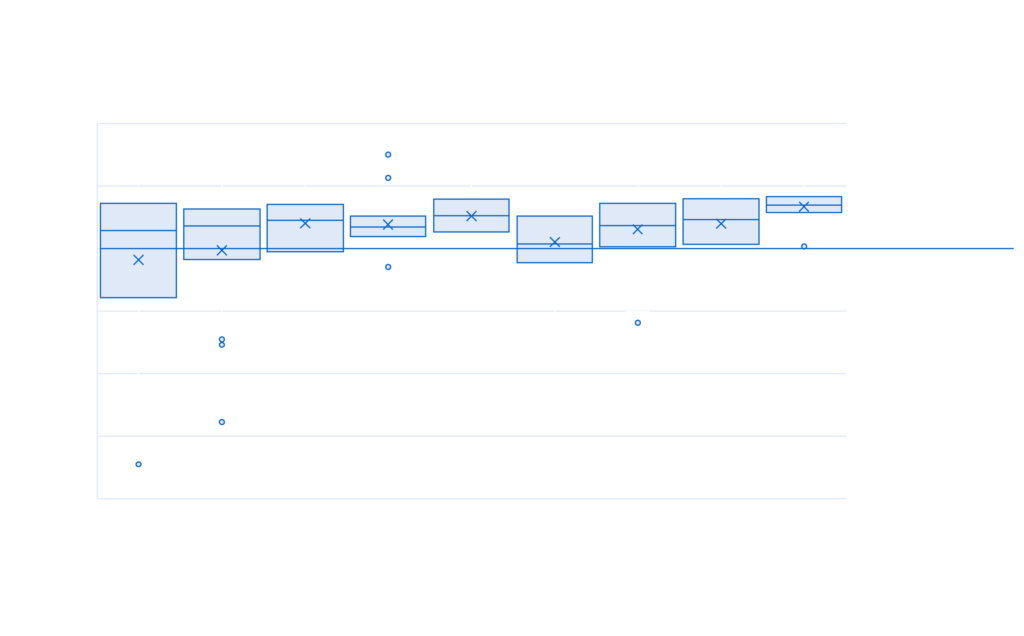
Power Degradation of MSS BOMs

mechanical stress degradation

Before 2019, all results are only DML+TC50+HF10. 30% of 2019 results and all post-2019 results are SML+DML+TC50+HF10.

View Box Plot Interpretation Guide

See Top
Performers

Click here to see the 95 model types listed as Mechanical Stress Sequence Top Performers

MSS Test Result Spotlight

BOMs that are Top Performers undergoing MSS when mounted using traditional two-rail mount can exhibit weaknesses when using a tracker mount solution.

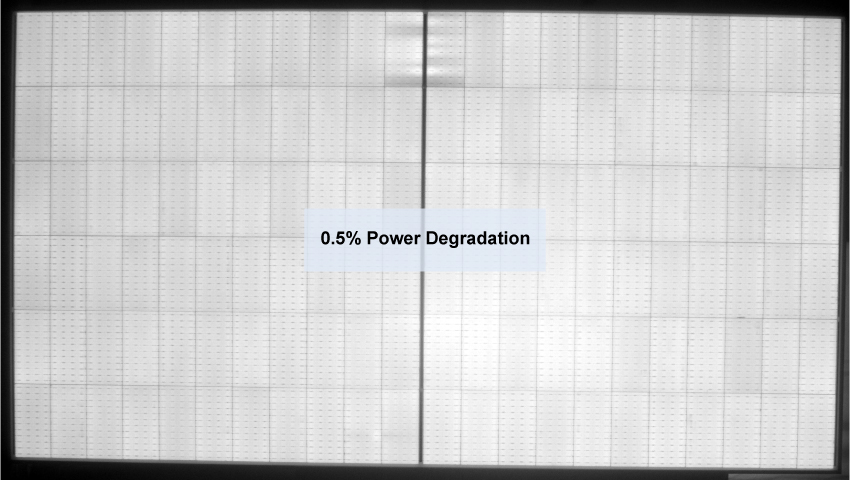
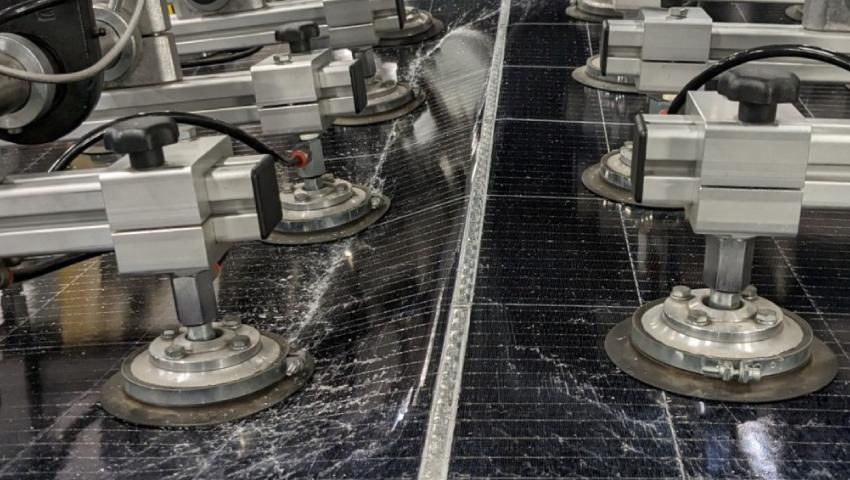
This example shows the same large-format glass//glass module (2384 x 1303 mm) performing exceptionally well during the standard MSS test (on the left), but experiencing glass breakage when tested at < 1600 Pa when mounted to a single axis tracker torque tube (on the right).

MSS – Two-rail Mounting

Post-MSS when using traditional two-rail mounting. Only 0.5% power degradation.

MSS – Tracker Mounting

The module broke during static mechanical load testing when mounted on a tracker torque tube.

Go beyond model types. Procure PV modules with top-performing bills of materials.

Join PVEL’s downstream partner network.

Sign Up

Continue Exploring the 2023 Scorecard